Skip to product information
1 of 10
Educator CreatedDesigned by teachers
30-day returnshassle-free
Secure paymentsSSL encrypted
Ships in 3 daysfrom the US
Kindergarten Grade 1 Grade 2 Grade 3-5

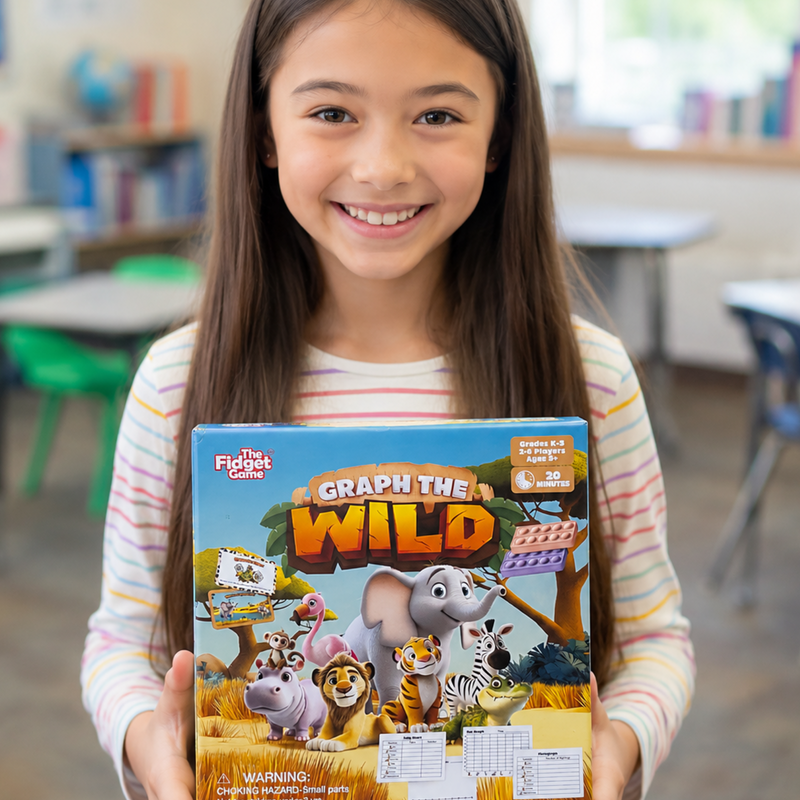
Graph the Wild

Graph the Wild

Regular price $29.99
Sale price $29.99 Regular price $34.99
Save $5.00 | 14% off Sold out
What's Inside The Box
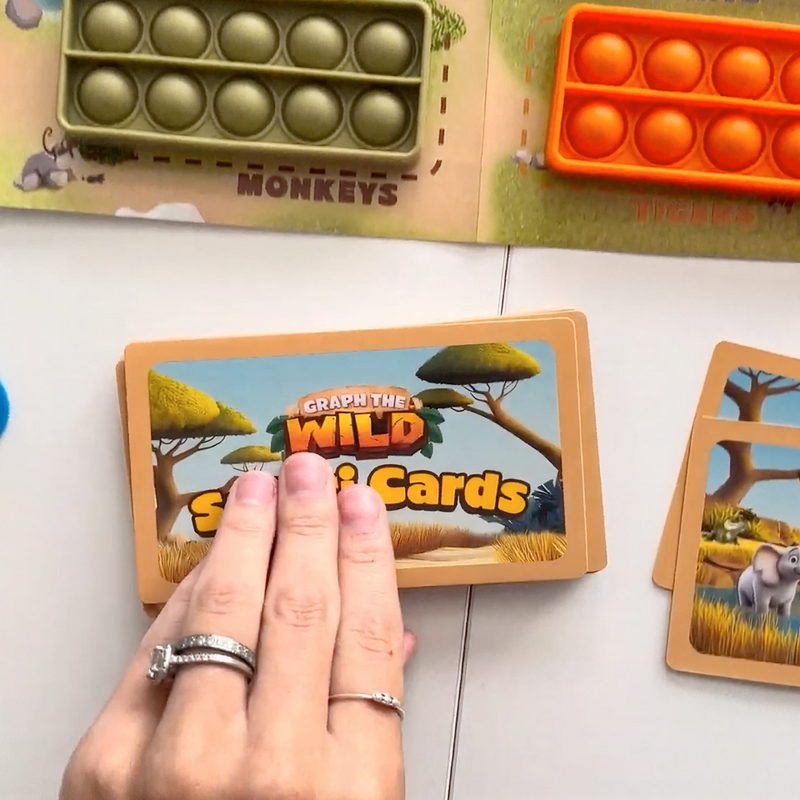
40 Safari Cards

40 Safari Cards

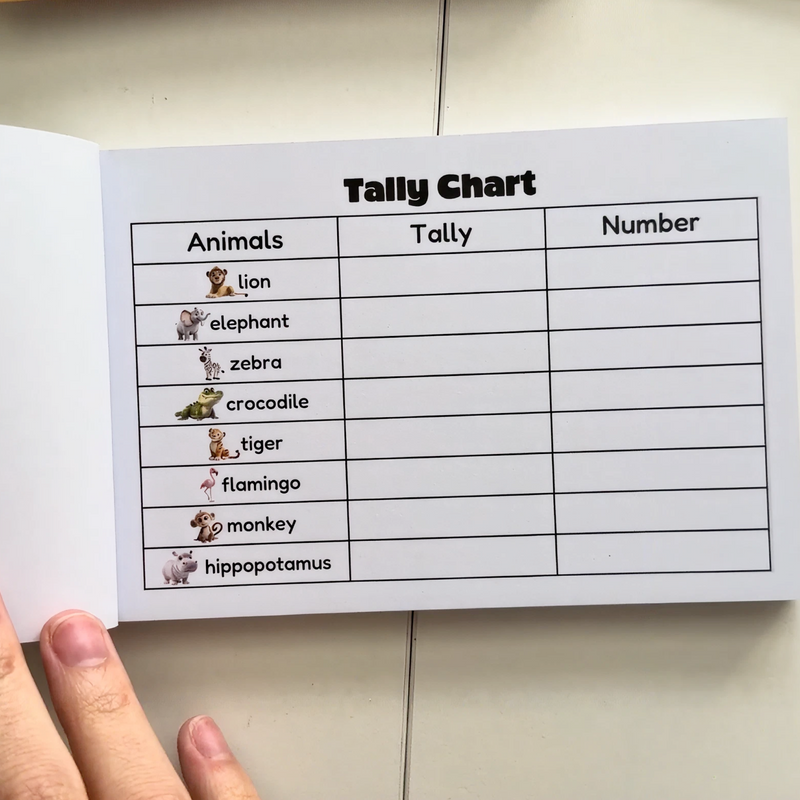
1 Graph Notebook

1 Graph Notebook

1 Spinner

1 Spinner

1 Safari Sighting Map

1 Safari Sighting Map

8 Ten Frame Fidgets

8 Ten Frame Fidgets

1 Sand Timer

1 Sand Timer

Skills Covered After 30 Days
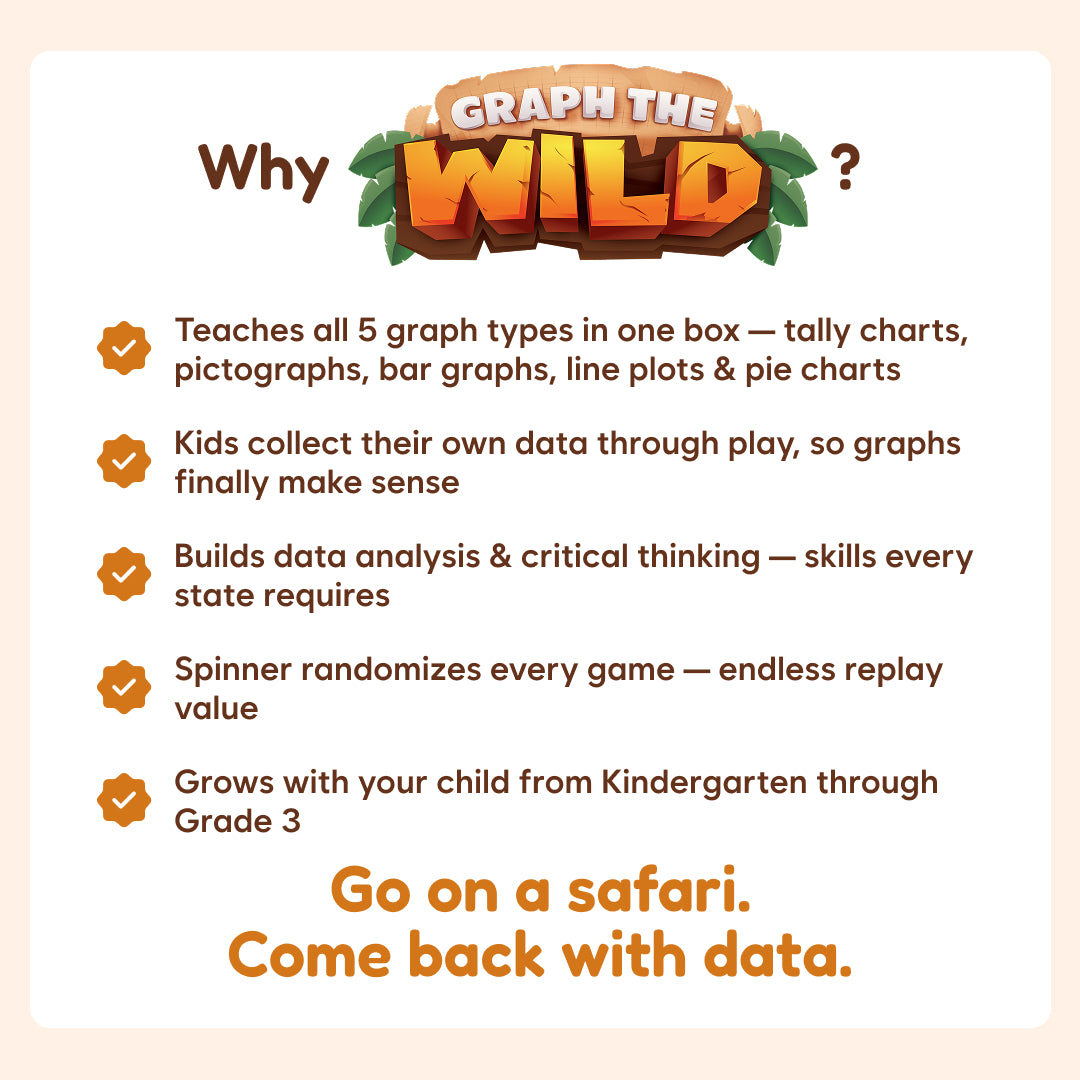
  • Teaches graphing through hands-on play: tally charts, pictographs, bar graphs, line plots, and pie charts
  • Builds data analysis and critical thinking skills
  • Makes data easy to understand with visual, concrete learning
  • Turns graphing practice into fun, engaging gameplay
Key Features
  • 2 to 6 players
  • Ages 5 to 9 (Grades K-3)
  • Quick and Easy Play (15  to 20 min)
Educational Standards
Common Core
  • CCSS.Math.Content.K.MD.B.3 Classify objects into given categories; count the numbers of objects in each category and sort the categories by count.
  • CCSS.Math.Content.1.MD.C.4 Organize, represent, and interpret data with up to three categories; ask and answer questions about the total number of data points, how many in each category, and how many more or less are in one category than in another.
  • CCSS.Math.Content.2.MD.D.10 Draw a picture graph and a bar graph (with single-unit scale) to represent a data set with up to four categories. Solve simple put-together, take-apart, and compare problems using information presented in a bar graph.
  • CCSS.Math.Content.3.MD.B.3 Draw a scaled picture graph and a scaled bar graph to represent a data set with several categories. Solve one- and two-step "how many more" and "how many less" problems using information presented in scaled bar graphs.
TEKS
  • K.8A: Collect, sort, and organize data into two or three categories.
  • K.8B: Use data to create real-object and picture graphs.
  • K.8C: Draw conclusions from real-object and picture graphs.
  • 1.8B: Use data to create picture and bar-type graphs.
  • 1.8C: Draw conclusions and generate and answer questions using information from picture and bar-type graphs.
  • 2.10A: Explain that the length of a bar in a bar graph or the number of pictures in a pictograph represents the number of data points for a given category.
  • 2.10B: Organize a collection of data with up to four categories using pictographs and bar graphs with intervals of one or more.
  • 2.10D: Draw conclusions and make predictions from information in a graph.
  • 3.8A: Summarize a data set with multiple categories using a frequency table, dot plot, pictograph, or bar graph with scaled intervals.
B.E.S.T.
  • MA.K.DP.1.1 Collect and sort objects into categories and compare the categories by counting the objects in each category. Report the results verbally, with a written numeral or with drawings.
  • MA.1.DP.1.1 Collect data into categories and represent the results using tally marks or pictographs.
  • MA.1.DP.1.2 Interpret data represented with tally marks or pictographs by calculating the total number of data points and comparing the totals of different categories.
  • MA.2.DP.1.1 Collect, categorize and represent data using tally marks, tables, pictographs or bar graphs. Use appropriate titles, labels and units.
  • MA.2.DP.1.2 Interpret data represented with tally marks, tables, pictographs or bar graphs including solving addition and subtraction problems.
  • MA.3.DP.1.1 Collect and represent numerical and categorical data with whole-number values using tables, scaled pictographs, scaled bar graphs or line plots. Use appropriate titles, labels and units.
  • MA.3.DP.1.2 Interpret data with whole-number values represented with tables, scaled pictographs, circle graphs, scaled bar graphs or line plots by solving one- and two-step problems.
Our games are used in 50,000+ classroomsSpecial discounts for school districts and homeschoolers. Get a Quote
View full details
Skills Built

What skills does Graph the Wild build?

Graphing
Turning number data into a picture
30-Day Money Back Guarantee
How to Play

How to play Graph the Wild

* Results based on internal study with regular users. Individual results may vary.

You ask, we answer!

My child hasn't learned graphing yet — is this too advanced?

Not at all. Kids gather the data themselves through play, so graphing feels natural instead of abstract. Kindergartners can start with tally charts and pictographs, and grow into bar graphs, line plots, and pie charts.

How is this different from a graphing worksheet?

The data is real — kids collected it themselves during the game. That ownership is what makes the graphs meaningful, and research shows kids retain concepts better when they generate the data.

Can different ages play together?

Yes. The card-drawing gameplay is accessible to a 5-year-old, while the graphing phase stretches older kids. The spinner also lets you control difficulty — younger groups can stick with pictographs.

Is it aligned to my state's standards?

Yes — Common Core, TEKS, and Florida B.E.S.T. are covered, plus a QR code links to Canadian standards alignment.

How long does a game take?

About 20 minutes — perfect for a math center rotation or a quick round at home.

What is the return policy?

We offer a 30-day return policy for eligible items.